Cinderella and her sisters
The results of the full observing run
of the Advanced LIGO detectors
(September 12, 2015, to January 19, 2016)
have been presented on June 8[4],
slightly updating some of the February's digits.
Figure 3 summarizes
detector performances and results, with some
important numbers (within this context) reminded in the caption.
Figure:
The Monster (GW150914), Cinderella (LVT151012)
and the third sister (GW151226), visiting us in 2015
(Fig. 1 of [4] - see text for the reason
of the names). The published `significance' of the three events
(Table 1 of [4]) is,
in the order, `` '', ``
 ''
and ``'', corresponding to the
following p-values:
''
and ``'', corresponding to the
following p-values:
 ,
,  ,
.
The log of the Bayes factors
are instead (Table 4 of [4]) approximately
289, 23 and 60, corresponding to Bayes factors
about
,
.
The log of the Bayes factors
are instead (Table 4 of [4]) approximately
289, 23 and 60, corresponding to Bayes factors
about
 ,
,  and
and  .
.
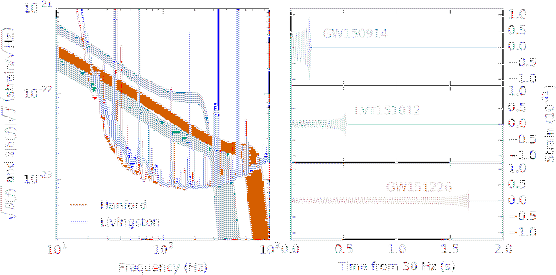 |
The busy plot on the left side shows the sensitivity curves of the
two interferometers (red and blue curves, with plenty of resonant
peaks) and how the three signals fall inside them (bands with colors
matching the wave forms of the right plot).
In short, the two curves tell us
that a signal of a given frequency can
be distinguished from the noise if its amplitude is above
them. Therefore all initial parts of the waves,
when the black holes begin to spiral around each
other at low frequency, are unobservable, and the bands
below  Hz are extrapolations from the physical models.
Later, when the frequency increases, the wave enters the
sensitivity range,21
which extends up to a given frequency, after which we `loose' it.
The lower and upper boundary frequencies
depend on the amplitude of the signal, as it also happens
in acoustics.
Hz are extrapolations from the physical models.
Later, when the frequency increases, the wave enters the
sensitivity range,21
which extends up to a given frequency, after which we `loose' it.
The lower and upper boundary frequencies
depend on the amplitude of the signal, as it also happens
in acoustics.
The plot on the right shows finally the `waves'22
from the instant
they enter the optimal 30Hz sensitivity region
(the acoustic analogy depicted in
footnote20 might help):
- The wave indicated by GW150914 (the `Monster', with
GW standing for gravitational wave and 150914 for the
detection date, September 14, 2015) is characterized
by high amplitude, but short duration in the sensitivity
region, because it fades out at a few hundred hertz.
- GW151226 instead, although of smaller intensity, has a longer `life'
(about 1.7 seconds)
in the `audible' spectrum, and therefore the signature
of a BBH merger is also very recognizable.
- Then there is the October 12 event,
LVT151012, which has an amplitude comparable to that of GW151226, but
smaller duration.
It has, nevertheless, about 20 oscillations in
the sensitivity region, an information that, combined
with the peculiar shape of the signal (remarkably the
crests get closer as time passes, while the amplitude
increases, until something `catastrophic'
seems to happen) and the fact
that two practically `identical' and `simultaneous'
signals have been observed by
the two interferometers 3000 km apart,
makes the experts highly confident that this is also
a gravitational wave.
However, even if at a first sight it does not look dissimilar from
GW151226 (but remember that the waves in
Fig.3 do not show raw data!),
the October 12 event,
hereafter referred as
Cinderella,
is not ranked as GW, but, more modestly,
as LVT, for LIGO-Virgo Trigger. The reason of the downgrading
is that `she' cannot wear a `` 's dress''
to go together with the `sisters' to the `sumptuous ball
of the Establishment.'
In fact Chance has assigned `her' only a poor,
unpresentable
ranking, usually considered in the Particle Physics community not
even worth a mention in a parallel session of a minor conference
by an undergraduate student.23
But, despite the modest `statistical significance',
experts are highly confident,
because of physics reasons24(and of their understanding of background), that this
is also a gravitational wave radiated by a BBH merger,
much more than the 87% quoted in
[4].25Indeed the most useful number experimentalists
can provide to the scientific community to quantify
how the experimental data alone favor the 'Signal' hypothesis
is the Bayes factor, as expounded in the preamble.
And this factor
is very large also for Cinderella:
's dress''
to go together with the `sisters' to the `sumptuous ball
of the Establishment.'
In fact Chance has assigned `her' only a poor,
unpresentable
ranking, usually considered in the Particle Physics community not
even worth a mention in a parallel session of a minor conference
by an undergraduate student.23
But, despite the modest `statistical significance',
experts are highly confident,
because of physics reasons24(and of their understanding of background), that this
is also a gravitational wave radiated by a BBH merger,
much more than the 87% quoted in
[4].25Indeed the most useful number experimentalists
can provide to the scientific community to quantify
how the experimental data alone favor the 'Signal' hypothesis
is the Bayes factor, as expounded in the preamble.
And this factor
is very large also for Cinderella:
 .
This means that,
even if your initial odds Signal Vs Noise were one
to one million, the
observation of the LIGO interferometers turns them into
10,000 to 1, i.e. a probability of BBH merger of
99.99%.26
.
This means that,
even if your initial odds Signal Vs Noise were one
to one million, the
observation of the LIGO interferometers turns them into
10,000 to 1, i.e. a probability of BBH merger of
99.99%.26
Now the question is, how can a modest  effect
be compatible with a Bayes factor as large as
? The solution to this apparent
paradox will be given in the next section, but
I anticipate the answer: p-values and BF's are two different
things, and there is no simple, general rule, inside probability theory,
that relates them.
effect
be compatible with a Bayes factor as large as
? The solution to this apparent
paradox will be given in the next section, but
I anticipate the answer: p-values and BF's are two different
things, and there is no simple, general rule, inside probability theory,
that relates them.
Giulio D'Agostini
2016-09-06