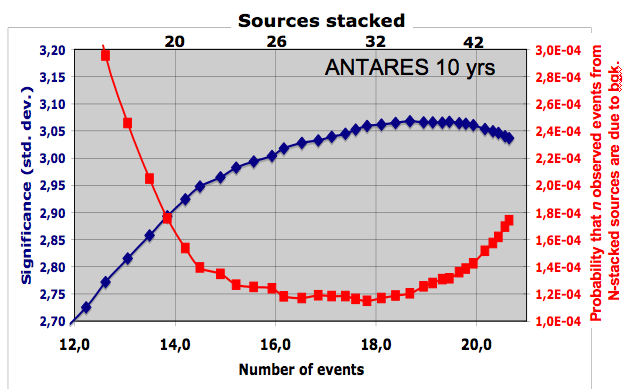
| Blue curve: expected significance (in standard deviation) for the stacking analysis of the galactic sources detected by H.E.S.S as a function of the number of expected cumulative events in 10 years of observation. |
| Red curve: probability that the number of observed events is due to the background as a function of the number of expected cumulative events in 10 years of observation. |
| Top of the plot: the number of stacked sources correspondent to the expected cumulative number of events. |
