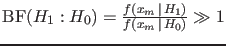
P-values Vs Bayes factors
Having discussed at length this topic elsewhere
(see in particular sections 1.8, and 10.8 of [8]),
I sketch here the main points,
with the help of some plots. This is obviously
a didactic example and does not enter at all into the
(very complicate and CPU time consuming) details
of the analysis of the interferometer data
(see footnote 18).
In particular a direct observation will be considered, while
in general hypothesis tests are performed on a statistic
chosen with large freedom.27
So we just consider
here simple models  that could produce the
quantity
that could produce the
quantity  according to pdf's
 .
.
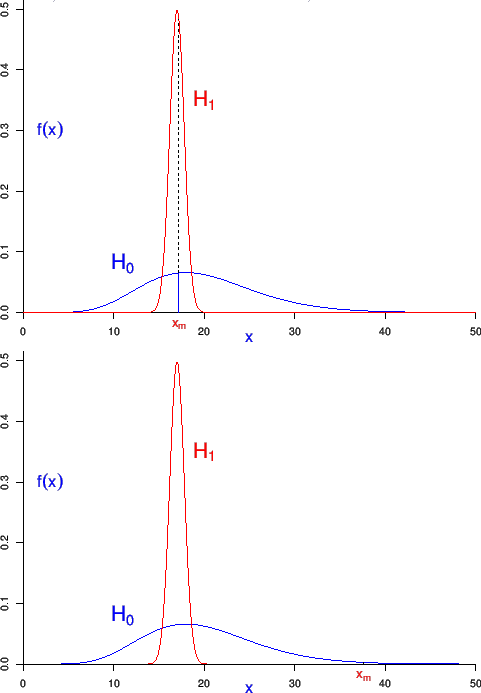
- As reminded above, according to probability theory
what matters for the update of relative beliefs
is the ratio of the pdf's. For example the observation
 shown in the upper plot of Fig.4
modifies our beliefs
in favor of
shown in the upper plot of Fig.4
modifies our beliefs
in favor of  , with respect to
  and
and  ,
no matter the size of the area
under the pdf's right of
,
no matter the size of the area
under the pdf's right of  .
.
Figure:
Several models that could have produced
the observed value of [8].
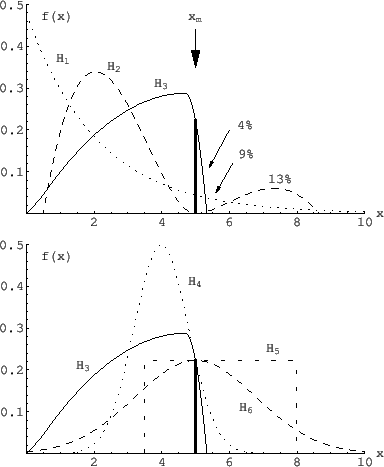 |
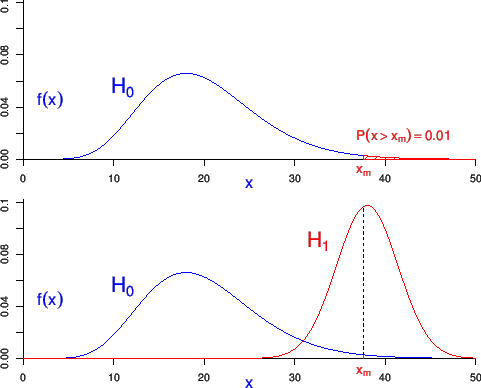
- In particular is ruled out (`falsified') because,
being
 , it cannot produce the observation,
despite it provides the highest
probability of
, it cannot produce the observation,
despite it provides the highest
probability of  .28
.28
- It follows that, if the values of pdf's
 are equal for all , as in the lower plot of Fig.4,
then the experiment is irrelevant and we
hold our beliefs,
independently of how far occurs from the expected
values
are equal for all , as in the lower plot of Fig.4,
then the experiment is irrelevant and we
hold our beliefs,
independently of how far occurs from the expected
values
![$\mbox{E}[X\,\vert\,H_i]$](img116.png) , or of the size of the area left or right
.
, or of the size of the area left or right
.
- The reason why p-values `often work'
(and can then be useful alarm bells when
getting experiments running, or validating
freshly collected data),
is quite simple.
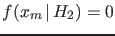
- Small p-values are normally associated
to small values of the pdf, as shown in the
upper plot of Fig.5.
Figure:
Pdf's of  given the null hypothesis
 and the alternative hypothesis .
 |
- It is then conceivable
an alternative hypothesis
such that
 ,
as shown in the bottom plot of Fig.5.
,
as shown in the bottom plot of Fig.5.
- Then, if this is the case, the observed
would push our beliefs towards , in the sense
 .
.
- BUT we need to take into account also
the priors odds
 .
.
- In the extreme case such a conceivable
could not exist,
or it could be
not
believable,29 or it could be just ad hoc, as it happens in recent
years, with a plethora
of `theorists' who give credit to any
fluctuation.
If this is the case, as it is often the case in frontier physics,
then

-
- the smallness of the
p-value is irrelevant!
(Note that if, instead of the smallness of the value of the pdf,
the rational were really the smallness of the area below the pdf,
than the absurd situation might arise in which one could choose
a ``rejection area'' anywhere, as shown in chapter 1 of [8].)
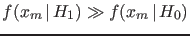
- Finally, in order
to understand the apparent paradox of
large p-value and indeed very large BF, think at a very predictive
model , whose pdf of the observable
overlaps with that of , like in the upper plot of
Fig.6.
Figure:
Pdf's of given the null hypothesis
and the alternative hypothesis
(case of overlapping pdf's).
 |
We clearly see that
,
thus resulting in a Bayes factor highly in favor of ,
although the p-value calculated from the null hypothesis
would be absolutely
insignificant. Something like that
occurs in the analysis of the gravitational wave
analysis, the case of Cinderella being the most
striking one.30
- And `paradoxically' - this is just a colloquial term,
since there is no paradox at all - large
deviations from the expected value of given ,
corresponding to small p-values,
are those which favor , if and
are the only hypotheses in hand, as shown in the
bottom plot of the same figure.
Now, in the light of these examples,
I simply re-propose you the following sentence from the first principle
of the ASA's statement
``The smaller the
 -value, the greater the statistical
incompatibility of the data with the null hypothesis,
if the underlying assumptions used to calculate the
-value hold.''[2]
As you can now understand,
it is not a matter of assumptions concerning ,
but rather on whether alternative hypotheses to are
conceivable and, more important, believable!
-value, the greater the statistical
incompatibility of the data with the null hypothesis,
if the underlying assumptions used to calculate the
-value hold.''[2]
As you can now understand,
it is not a matter of assumptions concerning ,
but rather on whether alternative hypotheses to are
conceivable and, more important, believable!
Subsections
Giulio D'Agostini
2016-09-06