Figure 1 reports the upper plots
Figure:
CDF data[9] before and after
`arithmetic' background subtraction
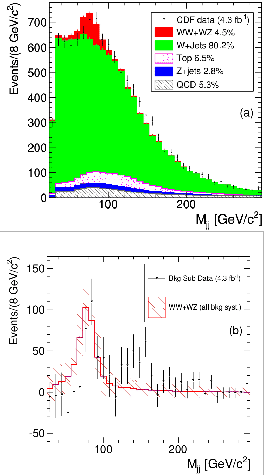 |
of figure 1 of the cited CDF paper.
The left side one shows the histogram of the
`data',3the jet-jet
mass distribution in 8 GeV bins, for a total of about
10800 events4
(points with vertical bars).
The colored regions show the predictions
split into several contributions, the most important
of which is due to the production
of two W bosons, or of a W boson together with
a Z boson (red).
We see that at
around 140 GeV there are more events than
`expected' (an expression which we shall return to later).
The right side plot shows the data after
the contributions called here `background'
(all but the red one of the left plot) were
subtracted `arithmetically'.5In the five bins between 120 and 160 GeV there are about
230 events (but in the side bins there are even
`negative events' whose meaning is only mathematical).
That was `the excess'.
Giulio D'Agostini
2012-01-02