Next: Uncertainty due to systematic
Up: Counting experiments
Previous: Binomially distributed observables
Contents
Poisson distributed quantities
As is well known, the typical application of the Poisson
distribution is in counting experiments
such as source activity,
cross-sections, etc. The unknown parameter to be
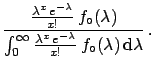
inferred is  . Applying the Bayes formula
we get
. Applying the Bayes formula
we get
Assuming5.7
 constant up to a certain
 and making the integral by parts we obtain
where the last result has been obtained by integrating
(![[*]](file:/usr/lib/latex2html/icons/crossref.png) ) also
by parts.
Figure shows how to build the
credibility intervals, given a certain measured
number of counts
) also
by parts.
Figure shows how to build the
credibility intervals, given a certain measured
number of counts  .
.
Figure:
Poisson parameter inferred from
an observed number of counts.
 |
Figure shows some numerical examples.
Figure:
Examples of
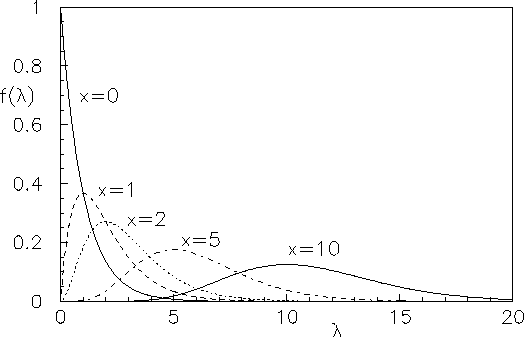 .
.
 |
 has the following properties.
- The expectation values, variance, and value of maximum
probability are
E![$\displaystyle [\lambda]$](img807.png) |
 |
 |
(5.56) |
Var |
|
|
(5.57) |
 |
|
 |
(5.58) |
The fact that the best estimate of in the Bayesian sense
is not the intuitive value but  should neither surprise,
nor disappoint us. According to the
initial distribution used ``there are always more possible
values of on the right side than on the left side of '',
and they pull the distribution to their side; the full information
is always given by
and the use of the mean is just a
rough approximation; the difference from the ``desired'' intuitive value
in units of the standard deviation goes as
should neither surprise,
nor disappoint us. According to the
initial distribution used ``there are always more possible
values of on the right side than on the left side of '',
and they pull the distribution to their side; the full information
is always given by
and the use of the mean is just a
rough approximation; the difference from the ``desired'' intuitive value
in units of the standard deviation goes as
 and becomes immediately negligible.
- When becomes large we get
| E |
 |
 |
(5.59) |
| Var |
|
|
(5.60) |
 |
|
 |
(5.61) |
 |
 |
 |
(5.62) |
() is one of the most familar formulae
used by physicists to assess the uncertainty of a measurement,
although it is sometimes misused.
Let us conclude with a special case:  . As one might imagine,
the inference is highly sensitive
to the initial distribution.
Let us assume that the experiment was planned with
the hope of observing something, i.e. that it could
detect a handful of events within its lifetime. With this hypothesis
one may use any vague prior function not strongly peaked
at zero. We have already come
across a similar case in Section
,
concerning the upper limit of the neutrino mass. There it was shown
that reasonable hypotheses based on the positive attitude
of the experimentalist are almost equivalent
and that they give results consistent with detector performances.
Let us use then
the uniform distribution
. As one might imagine,
the inference is highly sensitive
to the initial distribution.
Let us assume that the experiment was planned with
the hope of observing something, i.e. that it could
detect a handful of events within its lifetime. With this hypothesis
one may use any vague prior function not strongly peaked
at zero. We have already come
across a similar case in Section
,
concerning the upper limit of the neutrino mass. There it was shown
that reasonable hypotheses based on the positive attitude
of the experimentalist are almost equivalent
and that they give results consistent with detector performances.
Let us use then
the uniform distribution
 |
|
 |
(5.63) |
 |
|
 |
(5.64) |
|
 |
 at at 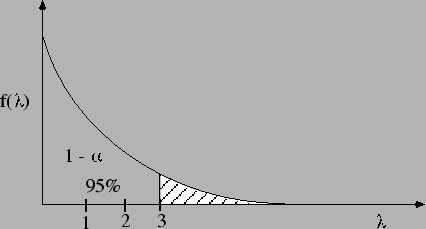 probability probability |
(5.65) |
Figure:
Upper limit to having observed 0 events.
 |
Next: Uncertainty due to systematic
Up: Counting experiments
Previous: Binomially distributed observables
Contents
Giulio D'Agostini
2003-05-15