


Next: Global combination and results
Up: Inferring and of the
Previous: Partial combinations of results
The treatment of the experimental information about
 cannot be done by the usual uncertainty propagation, just
because the simplifying hypotheses (linearization and
Gaussian model for
cannot be done by the usual uncertainty propagation, just
because the simplifying hypotheses (linearization and
Gaussian model for  ) do not hold.
In fact, the likelihood, which has the role of reweighting
the probability, is open, in the sense described
in Section 7 of Ref. [7], i.e. it does not go to zero
at both ends of the kinematical region (
) do not hold.
In fact, the likelihood, which has the role of reweighting
the probability, is open, in the sense described
in Section 7 of Ref. [7], i.e. it does not go to zero
at both ends of the kinematical region ( and
and
 in this case), as shown in the top
plot of Fig. 7.
The reason is simple: in this kind of measurement
is not yet incompatible with
in this case), as shown in the top
plot of Fig. 7.
The reason is simple: in this kind of measurement
is not yet incompatible with  (no oscillation).
Though the open likelihood does not allow to renormalize the p.d.f.
(unless strong priors forbidding high values are used),
the likelihood can still be used to reweigh the points in the
(no oscillation).
Though the open likelihood does not allow to renormalize the p.d.f.
(unless strong priors forbidding high values are used),
the likelihood can still be used to reweigh the points in the
 -
- plane (see Refs. [5] and
[8] for other examples and discussions about the
plane (see Refs. [5] and
[8] for other examples and discussions about the  function).
It is instructive to see how the reweighting of is
turned into the reweighting of the square radius of circle centered
in  and
and  given by the constraint
  ,
i.e.
,
i.e.
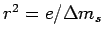 . This is illustrated in the central plot of
Fig. 7. We see that the reflection of
. This is illustrated in the central plot of
Fig. 7. We see that the reflection of
 for
for
 ps
ps essentially kills values above
 , resulting in a strong sensitivity bound (in the sense
of Ref. [7]) on the angle
, resulting in a strong sensitivity bound (in the sense
of Ref. [7]) on the angle  of the CKM matrix,
forced to be
below 90
of the CKM matrix,
forced to be
below 90 . The bottom plot of Fig. 7 shows the
reweighting function in the - plane.
. The bottom plot of Fig. 7 shows the
reweighting function in the - plane.
For small values of  the reweighting function is
divergent, since the whole region of high
is squeezed into a small region of . This is no serious
problem, since these points are already ruled out by the other
constraints. The cutoff shown in the central and bottom plot
of Fig. 7 is due to a cutoff at
the reweighting function is
divergent, since the whole region of high
is squeezed into a small region of . This is no serious
problem, since these points are already ruled out by the other
constraints. The cutoff shown in the central and bottom plot
of Fig. 7 is due to a cutoff at
 ps.
Note, moreover, that the values of preferred by the data
(around 15-20 ps) overlap well with the
- region indicated by the other constraints.
Note also that even if one goes through the academic exercise
of removing by
hand the peak around 15-20 ps, chopping to 1,
the effect on the values
of
ps.
Note, moreover, that the values of preferred by the data
(around 15-20 ps) overlap well with the
- region indicated by the other constraints.
Note also that even if one goes through the academic exercise
of removing by
hand the peak around 15-20 ps, chopping to 1,
the effect on the values
of  above 1 (and hence of above 90) does
not change.
above 1 (and hence of above 90) does
not change.
Figure:
Top plot: likelihood of
rescaled to the region of insensitivity. Central plot: reweighting
factor of
. The peak just below
0.2 is an artifact of the cutoff in (see text).
Bottom plot: same reweighting
factor in the - plane (note also here the
low cutoff).
 |
Next: Global combination and results
Up: Inferring and of the
Previous: Partial combinations of results
Giulio D'Agostini
2004-01-20