


Next: P-value analysis of the
Up: Bayesian model comparison applied
Previous: Introduction
Figure 1:
Explorer-Nautilus coincidence events (upper plot) and
background estimates (lower plot)
as a function of the sidereal time in 1/2 hour bins.
 |
This analysis has been performed on a data set of Explorer-Nautilus
coincidences with an energy filter veto
(i.e. requiring agreement between the event energies of the two antennae)
and with a fixed time window of 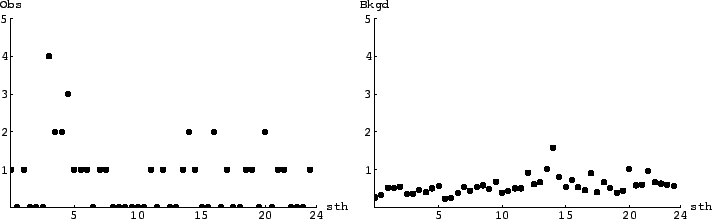 s.
Data we are referring to are
those obtained using runs longer than 12 hours.
The data are grouped in
half hour bins of
sidereal time, as shown
in Fig. 1.
The upper plot of the figure reports
the number of observed coincidences (
s.
Data we are referring to are
those obtained using runs longer than 12 hours.
The data are grouped in
half hour bins of
sidereal time, as shown
in Fig. 1.
The upper plot of the figure reports
the number of observed coincidences ( ), while the lower plot
gives the average number of the background events
estimated by off-time techniques.
It is worth remarking that the method we are going to use does not
depend critically
on the width of the bins, provided that the width
is small enough to assure a good resolution of the antenna pattern.
(To state it clearly, contrary to other methods in which some binning
is required and the resulting significance
depends dramatically on the choice of the binning,
in our method we could have, virtually,
bins of arbitrary small width. Rebinning
does not spoils the quality of the information, as long as
the binning is finer than the structures exhibited by the
antenna pattern
and there are no clustering of events
within a bin. The latter possibility is excluded by inspecting the
arrival time of the individual events, as shown in Ref. [1]
for the events around 4:00.)
), while the lower plot
gives the average number of the background events
estimated by off-time techniques.
It is worth remarking that the method we are going to use does not
depend critically
on the width of the bins, provided that the width
is small enough to assure a good resolution of the antenna pattern.
(To state it clearly, contrary to other methods in which some binning
is required and the resulting significance
depends dramatically on the choice of the binning,
in our method we could have, virtually,
bins of arbitrary small width. Rebinning
does not spoils the quality of the information, as long as
the binning is finer than the structures exhibited by the
antenna pattern
and there are no clustering of events
within a bin. The latter possibility is excluded by inspecting the
arrival time of the individual events, as shown in Ref. [1]
for the events around 4:00.)
As far as the background is concerned, we recall that the random
coincidence
background is well described by a Poisson
distribution [1],
and that the sidereal hour fluctuations of the averages
is compatible with the grand average over the 24 hours
of
 events/hour. For these reasons, we believe that
the the value of
events/hour. For these reasons, we believe that
the the value of
 is the most reasonable value
to use as parameter of the Poisson distribution which models
the background fluctuation in the 0.5-hour bins.
is the most reasonable value
to use as parameter of the Poisson distribution which models
the background fluctuation in the 0.5-hour bins.
Next: P-value analysis of the
Up: Bayesian model comparison applied
Previous: Introduction
Giulio D'Agostini
2005-01-09