 |
(44) |
 |
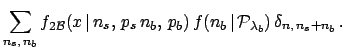
The middle plot in the figure is for ![]() .
Again, the case
.
Again, the case ![]() gives the
the pdf we already know. But as soon as some
background is hypothesized, the curves start
to drift to the right side. That is because
high background with low
gives the
the pdf we already know. But as soon as some
background is hypothesized, the curves start
to drift to the right side. That is because
high background with low ![]() favors large
values of
favors large
values of ![]() .
.
The opposite happens if we think that background
is characterized by large ![]() , as shown in
the bottom plot of the figure.
, as shown in
the bottom plot of the figure.