Next: Caveat concerning the blind
Up: Approximate methods
Previous: Evaluation of type B
Contents
Examples of type B uncertainties
- Previous measurements of other particular quantities,
performed in similar conditions, have provided a repeatability
standard deviation6.4 of
 :
:
- A manufacturer's calibration certificate states that the uncertainty,
defined as
 standard deviations,
is ``
standard deviations,
is `` '':
'':
- A result
is reported
in a publication
as
 ,
stating that the average has been performed on four measurements
and the uncertainty is a
,
stating that the average has been performed on four measurements
and the uncertainty is a  confidence interval.
One has to conclude that the confidence interval has been calculated
using the Student
confidence interval.
One has to conclude that the confidence interval has been calculated
using the Student  :
:
- A manufacturer's specification states that the
error on a quantity should not exceed
 . With this
limited information one has to assume a uniform distribution:
. With this
limited information one has to assume a uniform distribution:
- A physical parameter of a Monte Carlo is believed to lie in the
interval of
around its best value,
but not with uniform distribution:
the degree of belief that the parameter is
at centre is higher than the degree of belief that it is at the edges of the
interval. With this information a
triangular distribution
can be reasonably assumed:
Note that the coefficient in front of
changes from the
 of the
previous example to the
of the
previous example to the  of this. If the interval
were a
of this. If the interval
were a  interval then the coefficient
would have been
equal to
interval then the coefficient
would have been
equal to  . These variations -- to
be considered extreme -- are smaller than
the statistical fluctuations of empirical standard
deviations estimated from
. These variations -- to
be considered extreme -- are smaller than
the statistical fluctuations of empirical standard
deviations estimated from
 measurements.
This shows that one should not be worried that the type B
uncertainties are less accurate than
type A, especially if one tries
to model
the distribution of the physical quantity
honestly.
measurements.
This shows that one should not be worried that the type B
uncertainties are less accurate than
type A, especially if one tries
to model
the distribution of the physical quantity
honestly.
- The absolute energy calibration of an electromagnetic
calorimeter module is not
known exactly and is estimated to be between the nominal one
and
 . The ``statistical'' error is known by test beam
measurements to be
. The ``statistical'' error is known by test beam
measurements to be
 . What is the uncertainty
on the energy measurement of an electron which has apparently released
30 GeV?
. What is the uncertainty
on the energy measurement of an electron which has apparently released
30 GeV?
- There is no type A uncertainty, since only one measurement
has been performed.
- The energy has to be corrected for the best estimate
of the calibration constant:
 , with an uncertainty of
 due to sampling (the ``statistical'' error):
GeV

- Then one has to take into account the uncertainty due to absolute energy
scale calibration:
- assuming a uniform
distribution of the true calibration constant,
 GeV:
GeV:
GeV
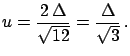
- assuming, more reasonably, a triangular distribution,
 GeV,
GeV,
GeV
- Interpreting the maximum deviation from the nominal calibration
as uncertainty
(see comment at the end of Section
![[*]](file:/usr/lib/latex2html/icons/crossref.png) ),
As already mentioned earlier in these notes,
while reasonable assumptions (in this case
the first two) give consistent results, this is not true if one
makes inconsistent use of the information just for the sake
of giving ``safe'' uncertainties.
),
As already mentioned earlier in these notes,
while reasonable assumptions (in this case
the first two) give consistent results, this is not true if one
makes inconsistent use of the information just for the sake
of giving ``safe'' uncertainties.
- Note added: the original version of the
primer contained at this point
a ``more realistic and slightly more complicated example'',
which requires, instead,
a next-to-linear treatment [45], which was not
included in the notes, neither is it in this new version.
Therefore, I prefer to skip
this example in order to avoid confusion.
Next: Caveat concerning the blind
Up: Approximate methods
Previous: Evaluation of type B
Contents
Giulio D'Agostini
2003-05-15