Next: Conclusion Up: Inferring vaccine efficacies and Previous: Model and analysis method
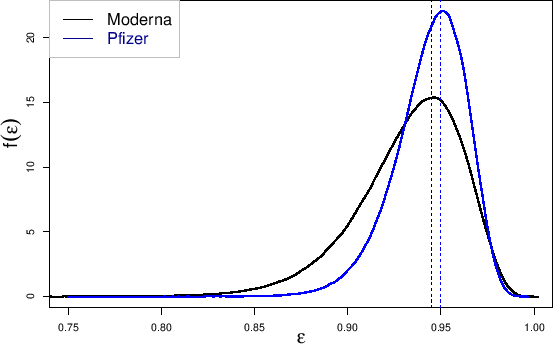
The results of the MCMC sampling are reported in Fig. 2
with smooth curves that follow the profile of the histograms of the MCMC `data' (one million steps have been chosen in order to reduce the sampling fluctuations): the black one (a bit broader) for Moderna; the blue one (a bit narrower) for Pfizer. The vertical dashed lines show the press release results of the two companies, that is 0.945 and 0.95, respectively. Indeed they correspond `practically exactly' to the modal values of the distributions. But this is only one possible summary of a distribution, and not always the best one, especially if not associated to an uncertainty (and, certainly, the `Usually our preference goes to the mean and the standard deviation because of rather general Probability Theory theorems, which make their use convenient for further evaluations (to this standard deviation is related the concept of standard uncertainty [3]). Other ways to summarize with just a couple of number a probability distribution is the `central' interval which contain the uncertain variable of interest at a given probability level credible interval. We report in the following table these summaries, that provide a quantitative evaluation of the uncertainty, together to the probability that the `true value' of the efficacy is larger than 90%, reminding however that the most complete, quantitative information of the inference is contained in the curves of Fig. 2:
| mean |
centr. 95% cred. int. |
|
|
| Moderna |
|
|
0.872 |
| Pfizer |
|
|
0.976 |
As it is easy to expect, the MCMC also provides results on the other
`unobserved' nodes of the causal model, in our case ![]() and
and
![]() . We refrain to quote results on the `assault probability',
because they could easily be misunderstood, as they strongly
depend, contrary to
. We refrain to quote results on the `assault probability',
because they could easily be misunderstood, as they strongly
depend, contrary to
![]() , on the precise values of
, on the precise values of ![]() and
and ![]() ,
being
,
being ![]() a catch-all quantity embedding several
real life variables, including the virus prevalence.
We give, instead,
the results concerning
a catch-all quantity embedding several
real life variables, including the virus prevalence.
We give, instead,
the results concerning ![]() , weakly dependent on
, weakly dependent on
![]() and
and ![]() and that we expect to be of the order of magnitude
of
and that we expect to be of the order of magnitude
of ![]() . We get, in fact, respectively for Moderna and Pfizer,
. We get, in fact, respectively for Moderna and Pfizer,
![]() and
and ![]() (note that the standard uncertainties
are not simply
(note that the standard uncertainties
are not simply
![]() , as a rule of thumb would suggest).
, as a rule of thumb would suggest).