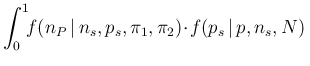
At this point we can convolute the uncertainty on the
number of positives in a sample,
analyzed in Sec. ![[*]](crossref.png) ,
with the uncertain value of
,
with the uncertain value of  due to sampling:
We start, as usual, with our exact reference values
of test sensitivity and specificity of 97.8% and
88.5% (
 and
and
 ), respectively, and perform the
integration by Monte Carlo.36
), respectively, and perform the
integration by Monte Carlo.36
Figure:
Probabilistic prediction of
the numbers of positives in a sample of 10000 individuals
taken from a population of 10000, 100000 and 1000000 individuals
(in order, from top to bottom), 10% of which
are infected ( ),
assuming
and
.
),
assuming
and
.
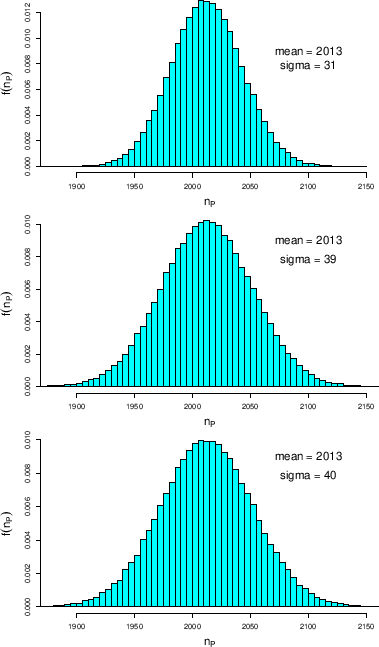 |
Some results are shown in Fig. ,
where, for comparison with what we have seen in the previous sections,
a sample size of 10000 individuals is used,
taken from a population of 10000 (top histogram),
100000 (middle) and 1000000 (bottom), and assuming .
 Note that first case
corresponds exactly to the assumed value of
Note that first case
corresponds exactly to the assumed value of
 shown in the top plot of
Fig. , since, being
shown in the top plot of
Fig. , since, being  ,
the standard uncertainty on vanishes.
,
the standard uncertainty on vanishes.![$]$](img65.png) Increasing the population size
the standard deviation increases, as an effect of
Increasing the population size
the standard deviation increases, as an effect of
 , although this growth saturates
for
, although this growth saturates
for  a bit higher than
 , above which
the size dependent factor of Eq. ()
becomes negligible. In fact, the asymptotic value,
given by Eq. () is in this case
, above which
the size dependent factor of Eq. ()
becomes negligible. In fact, the asymptotic value,
given by Eq. () is in this case
 .
For
.
For  the standard uncertainty on
becomes 0.00285, vanishing for
(the value of 0.0015, half of the asymptotic one, is
reached for
the standard uncertainty on
becomes 0.00285, vanishing for
(the value of 0.0015, half of the asymptotic one, is
reached for
 ).
).
Subsections
 d
d