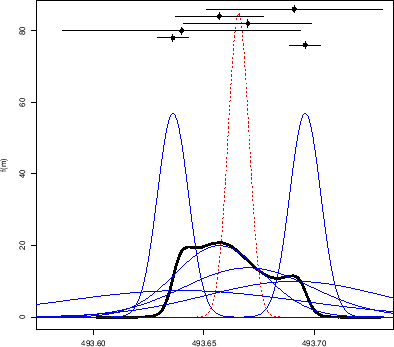
Once the  scaling factor on the lowest value is removed,
the weighted average is shifted down and falls right in the middle
of the two most measurements, as shown by the dashed line of
Fig. 13,
scaling factor on the lowest value is removed,
the weighted average is shifted down and falls right in the middle
of the two most measurements, as shown by the dashed line of
Fig. 13,
Figure:
Same as Fig. 10 removing
the
 scaling applied
by the authors [9] to the `error' of the result nr. 5
of Tab. 1.
scaling applied
by the authors [9] to the `error' of the result nr. 5
of Tab. 1.
 |
yielding
 MeV.
But a sceptical analysis yields a broader distribution,
overlapping the two precise measurements on the sides,
thus taking into serious account also the results in between.
Having to report the result as average and standard deviation of the
distribution we get then
MeV.
But a sceptical analysis yields a broader distribution,
overlapping the two precise measurements on the sides,
thus taking into serious account also the results in between.
Having to report the result as average and standard deviation of the
distribution we get then
 MeV
(but remember that the complete result is provided by the posterior
pdf evaluated by MCMC sampling).
MeV
(but remember that the complete result is provided by the posterior
pdf evaluated by MCMC sampling).
Looking into the details of the inference, we see that, as imaginable,
high values for  and
and  are preferred (
 and
and
 , respectively), while the others remain more or less
around the prior values of
, respectively), while the others remain more or less
around the prior values of  .
.