Next: Summing up Up: What is the probability Previous: Expected numbers of vaccinated
![[*]](crossref.png) ):
in the first case 30 people got a `severe form' out of 185
infectees in the control group; none of the severe cases occurred in the group of 11 vaccinated infectees;
in the second the corresponding numbers are 9 in 162
and 1 in 8.
):
in the first case 30 people got a `severe form' out of 185
infectees in the control group; none of the severe cases occurred in the group of 11 vaccinated infectees;
in the second the corresponding numbers are 9 in 162
and 1 in 8.
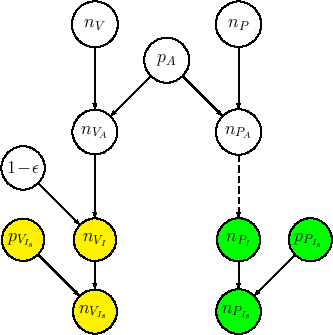
In order to analyze this further pieces of information we
can simply extend the Bayesian network of
Fig. adding four nodes
(see Fig. ):
    model {
      nP.I  ~ dbin(pA, nP)           #  1.
      nV.A  ~ dbin(pA, nV)           #  2.
      pA    ~ dbeta(1,1)             #  3.
      nV.I  ~ dbin(ffe, nV.A)        #  4.  [ ffe = 1 - eff ]
      ffe   ~ dbeta(1,1)             #  5.
      eff   <- 1 - ffe               #  6.
      pS_P  ~ dbeta(1,1)             #  7.
      pS_V  ~ dbeta(1,1)             #  8.
      nS.V  ~ dbin(pS_V,nV.I)        #  9.
      nS.P  ~ dbin(pS_P,nP.I)        # 10.
    }
However, looking at the Bayesian network of Fig. ,
it is clear that, being | Beta |
|||
| Beta |
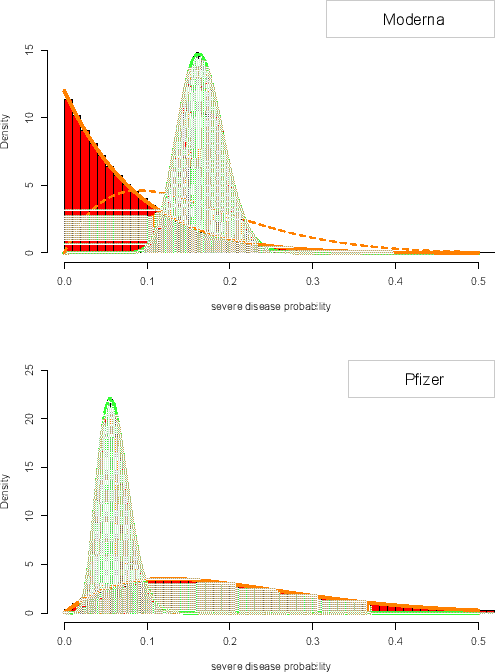
the histograms of the MCMC results with superimposed the Beta pdf's
(solid lines -
we shall come back later to meaning of
the dashed line added in the case of Moderna).
As far as the control groups are concerned
(green, narrower histograms and curves in Fig. ),
the results from Moderna and Pfizer data are quite different.
In both cases we get rather narrow distributions, as expected
from the rather large numbers involved (and therefore the central
values are close to the proportion of severe cases with respect
to the total number). But they differ substantially
and, using mean and standard deviation to summarize them,
we get
| Moderna: | |||
Passing to the vaccine groups (red, broader histograms and curves
in Fig. ),
the crude summaries in terms of mean and standard deviation give
| Moderna: | |||
| Pfizer: |
),
vanishing at zero and yielding
It is quite evident that it is not possible to draw general conclusions
on the efficacy of the generic vaccine on softening the impact of the disease.
But the real point we wish to highlight, given the spread
of distributions, is that we do not have enough data for drawing sound conclusion.
For this reason, we point that even for this aspect,
press releasing a 100% effect and not dealing with
the unavoidable uncertainties and their impact when applied
to decision making is quite misleading. Figure
indeed shows that the probability of becoming severely ill in
the vaccine group is definitively low but, quite obviously,
not zero and with a relevant overlap with the distribution
evaluated for the control group.