Ratio of Gamma distributed variables
Having inferred the two rates, we can now evaluate
the distribution of
 , which
is technically just a problem of `direct probabilities',
that is getting the pdf
, which
is technically just a problem of `direct probabilities',
that is getting the pdf
 from
from
 and
and
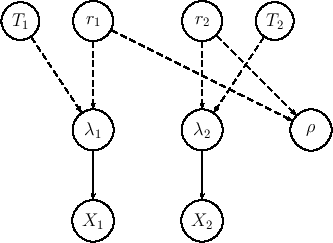
 (the Bayesian network that relates the variables
of interest is shown in Fig.
(the Bayesian network that relates the variables
of interest is shown in Fig. ![[*]](crossref.png) ).
).
Figure:
Graphical model relating the physical
quantities (rates and measurement times) to the observed
numbers of events.
 |
We just need to repeat what it has been
done in Sec. , taking the advantage
of having understood that
 and
and
 appearing in Eq. ()
are indeed Gamma distributions.
Therefore, we start evaluating the probability distribution of the ratio
of generic Gamma variables, denoted as
appearing in Eq. ()
are indeed Gamma distributions.
Therefore, we start evaluating the probability distribution of the ratio
of generic Gamma variables, denoted as  and
and  (and their possible occurrences
  and
and  ) in order
to avoid confusion with
) in order
to avoid confusion with  's, associated so far to measured counts:
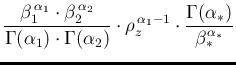
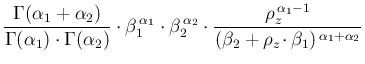
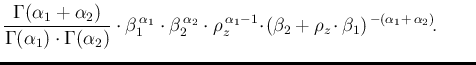
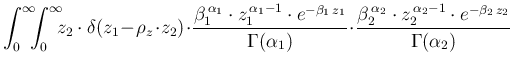
The pdf of  is the given by
in which we have indicated by  their ratio.
In detail, taking benefit of what we have
learned in Sec. ,
their ratio.
In detail, taking benefit of what we have
learned in Sec. ,
Writing
 as
as  and
and
 as
as  , we get
Subsections
 d
d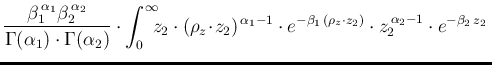 d
d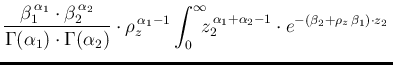 d
d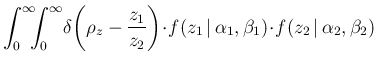 d
d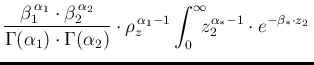 d
d