Inferring  from the observed number of positives in the sample
Let us finally move to the probabilistic inference of the proportion
of infected individuals, , based on the number of positives  in a sample of size
  and given our best knowledge of the
performance of the test, all summarized in the graphical
model of Fig.
and given our best knowledge of the
performance of the test, all summarized in the graphical
model of Fig. ![[*]](crossref.png) ,
,
Figure:
Graphical model of Fig. ,
re-drawn in order to emphasize its inferential use and
including the commands to build up the JAGS model. ` ',
left open in this diagram, stands for the prior distribution of .
',
left open in this diagram, stands for the prior distribution of .
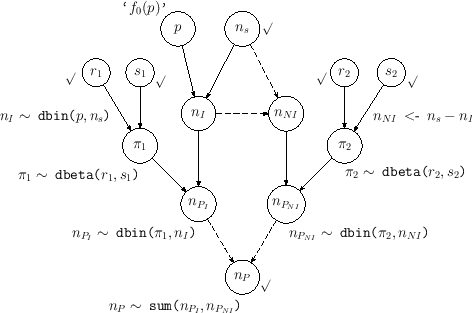 |
which differs from that of Fig.
only for the symbol ` ' moved
from node (now `unobserved') to node (now `observed').
The diagram contains also the probabilistic and deterministic
relations among the nodes, written directly using the
JAGS language.45
' moved
from node (now `unobserved') to node (now `observed').
The diagram contains also the probabilistic and deterministic
relations among the nodes, written directly using the
JAGS language.45
Subsections